Candlestick chart
Type of financial chart
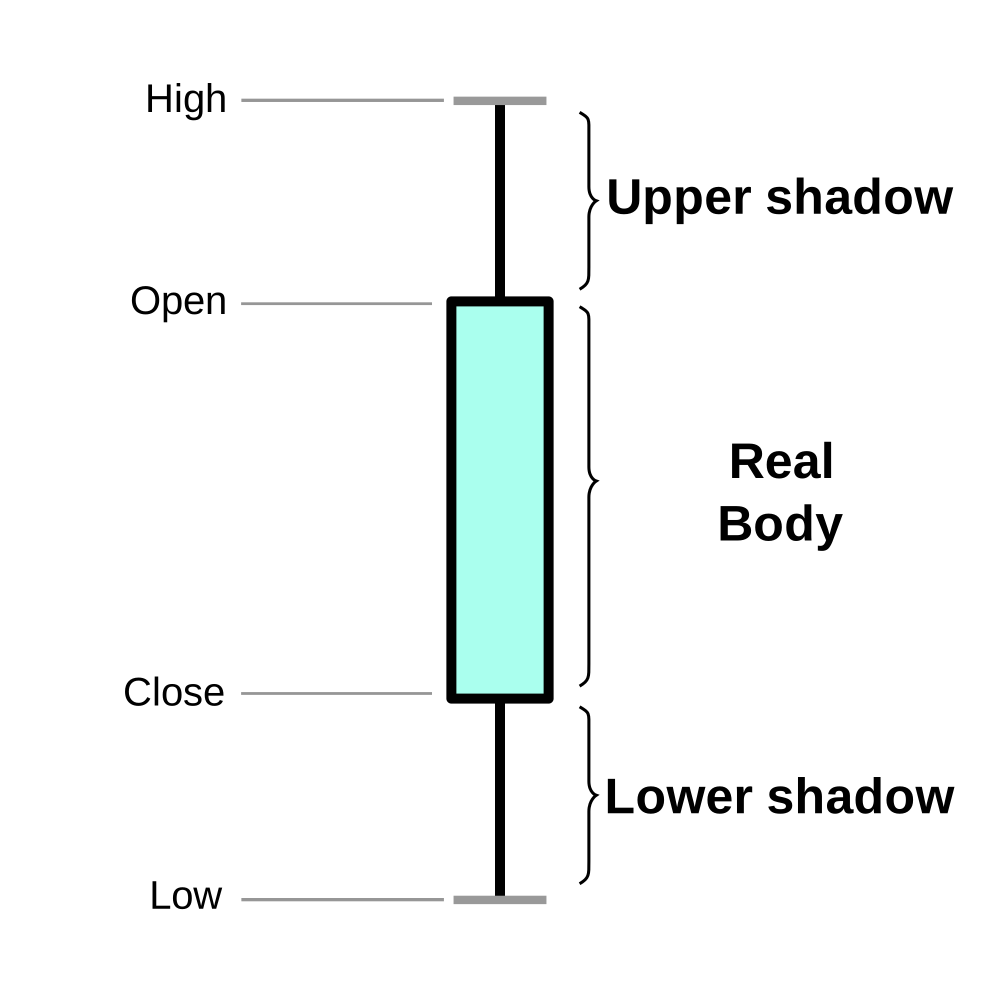
A candlestick chart (also called Japanese candlestick chart or K-line) is a style of financial chart used to describe price movements of a security, derivative, or currency. While similar in appearance to a bar chart, each "candle" represents four important pieces of information for that day: open and close in the thick body, and high and low in the "candle wick". Being densely packed with information, it tends to represent trading patterns over short periods of time, often a few days or a few trading sessions.
From Wikipedia, under CC BY-SA. More on occurri.